Usage & traffic
Tool-call volume, MCP client health, issues, goals, output tokens, and request geography for your server.
The Analytics tab answers the questions traditional web analytics can't: which tools are being called, by which AI clients, from where, and whether those calls succeed. All traffic through your server's gateway URL is measured automatically — no SDK or instrumentation required.
Summary counters
Four KPI cards at the top of the tab summarize the selected time window:
- Tool calls — total MCP tool invocations.
- Sessions — distinct interactions (grouped conversation units, not raw transport sessions).
- Error rate — percentage of gateway requests that failed.
- Avg latency — mean request duration across the window.
Issues
The Issues card groups recurring errors on your server so you can triage, resolve, and track them over time — instead of hunting through individual gateway events.
A trend chart at the top shows total issue occurrences over the selected time window. Status and kind filters apply to both the chart and the list below.
Each row summarizes one issue:
- Title and affected tool (when applicable)
- Kind — how the issue was detected
- A 14-day trend sparkline of occurrences
- Event and session counts
- Last seen timestamp
Expand a row to read a sample error message and see the sessions that hit this issue recently. Click a session to open the session timeline.
Kind filter
Filter issues by detection type:
| Kind | Description |
|---|---|
| Detected | AI-identified failures (brain icon) — distinct from transport or protocol errors |
| Tool error | Tool returned an error result |
| JSON-RPC | Protocol-level JSON-RPC errors |
| Transport | HTTP or connection failures |
Status workflow
Switch between status pills at the top of the card:
- Unresolved — active issues needing attention
- Resolved — fixed and closed
- Ignored — acknowledged but not actionable
- All — every issue regardless of status
Use row actions to Resolve, Reopen, Ignore, or Unignore an issue. Counts on each pill update as you triage.
For the raw event stream behind an issue, use Gateway Requests.
MCP Usage
The MCP Usage card charts tool, resource, and prompt activity over time. Switch the category chips to focus on Tools, Resources, Prompts, or All.
Each chart has its own granularity control — Month, Week, Day, Hour, or Min — so you can zoom from long-term trends down to the last hour.
Below the chart, a health table lists each entity with Calls, Error rate, Tool result error rate (tools only), and p50 / p95 / p99 latency. Expand a row to see grouped error messages and the sessions that hit that tool during the period.
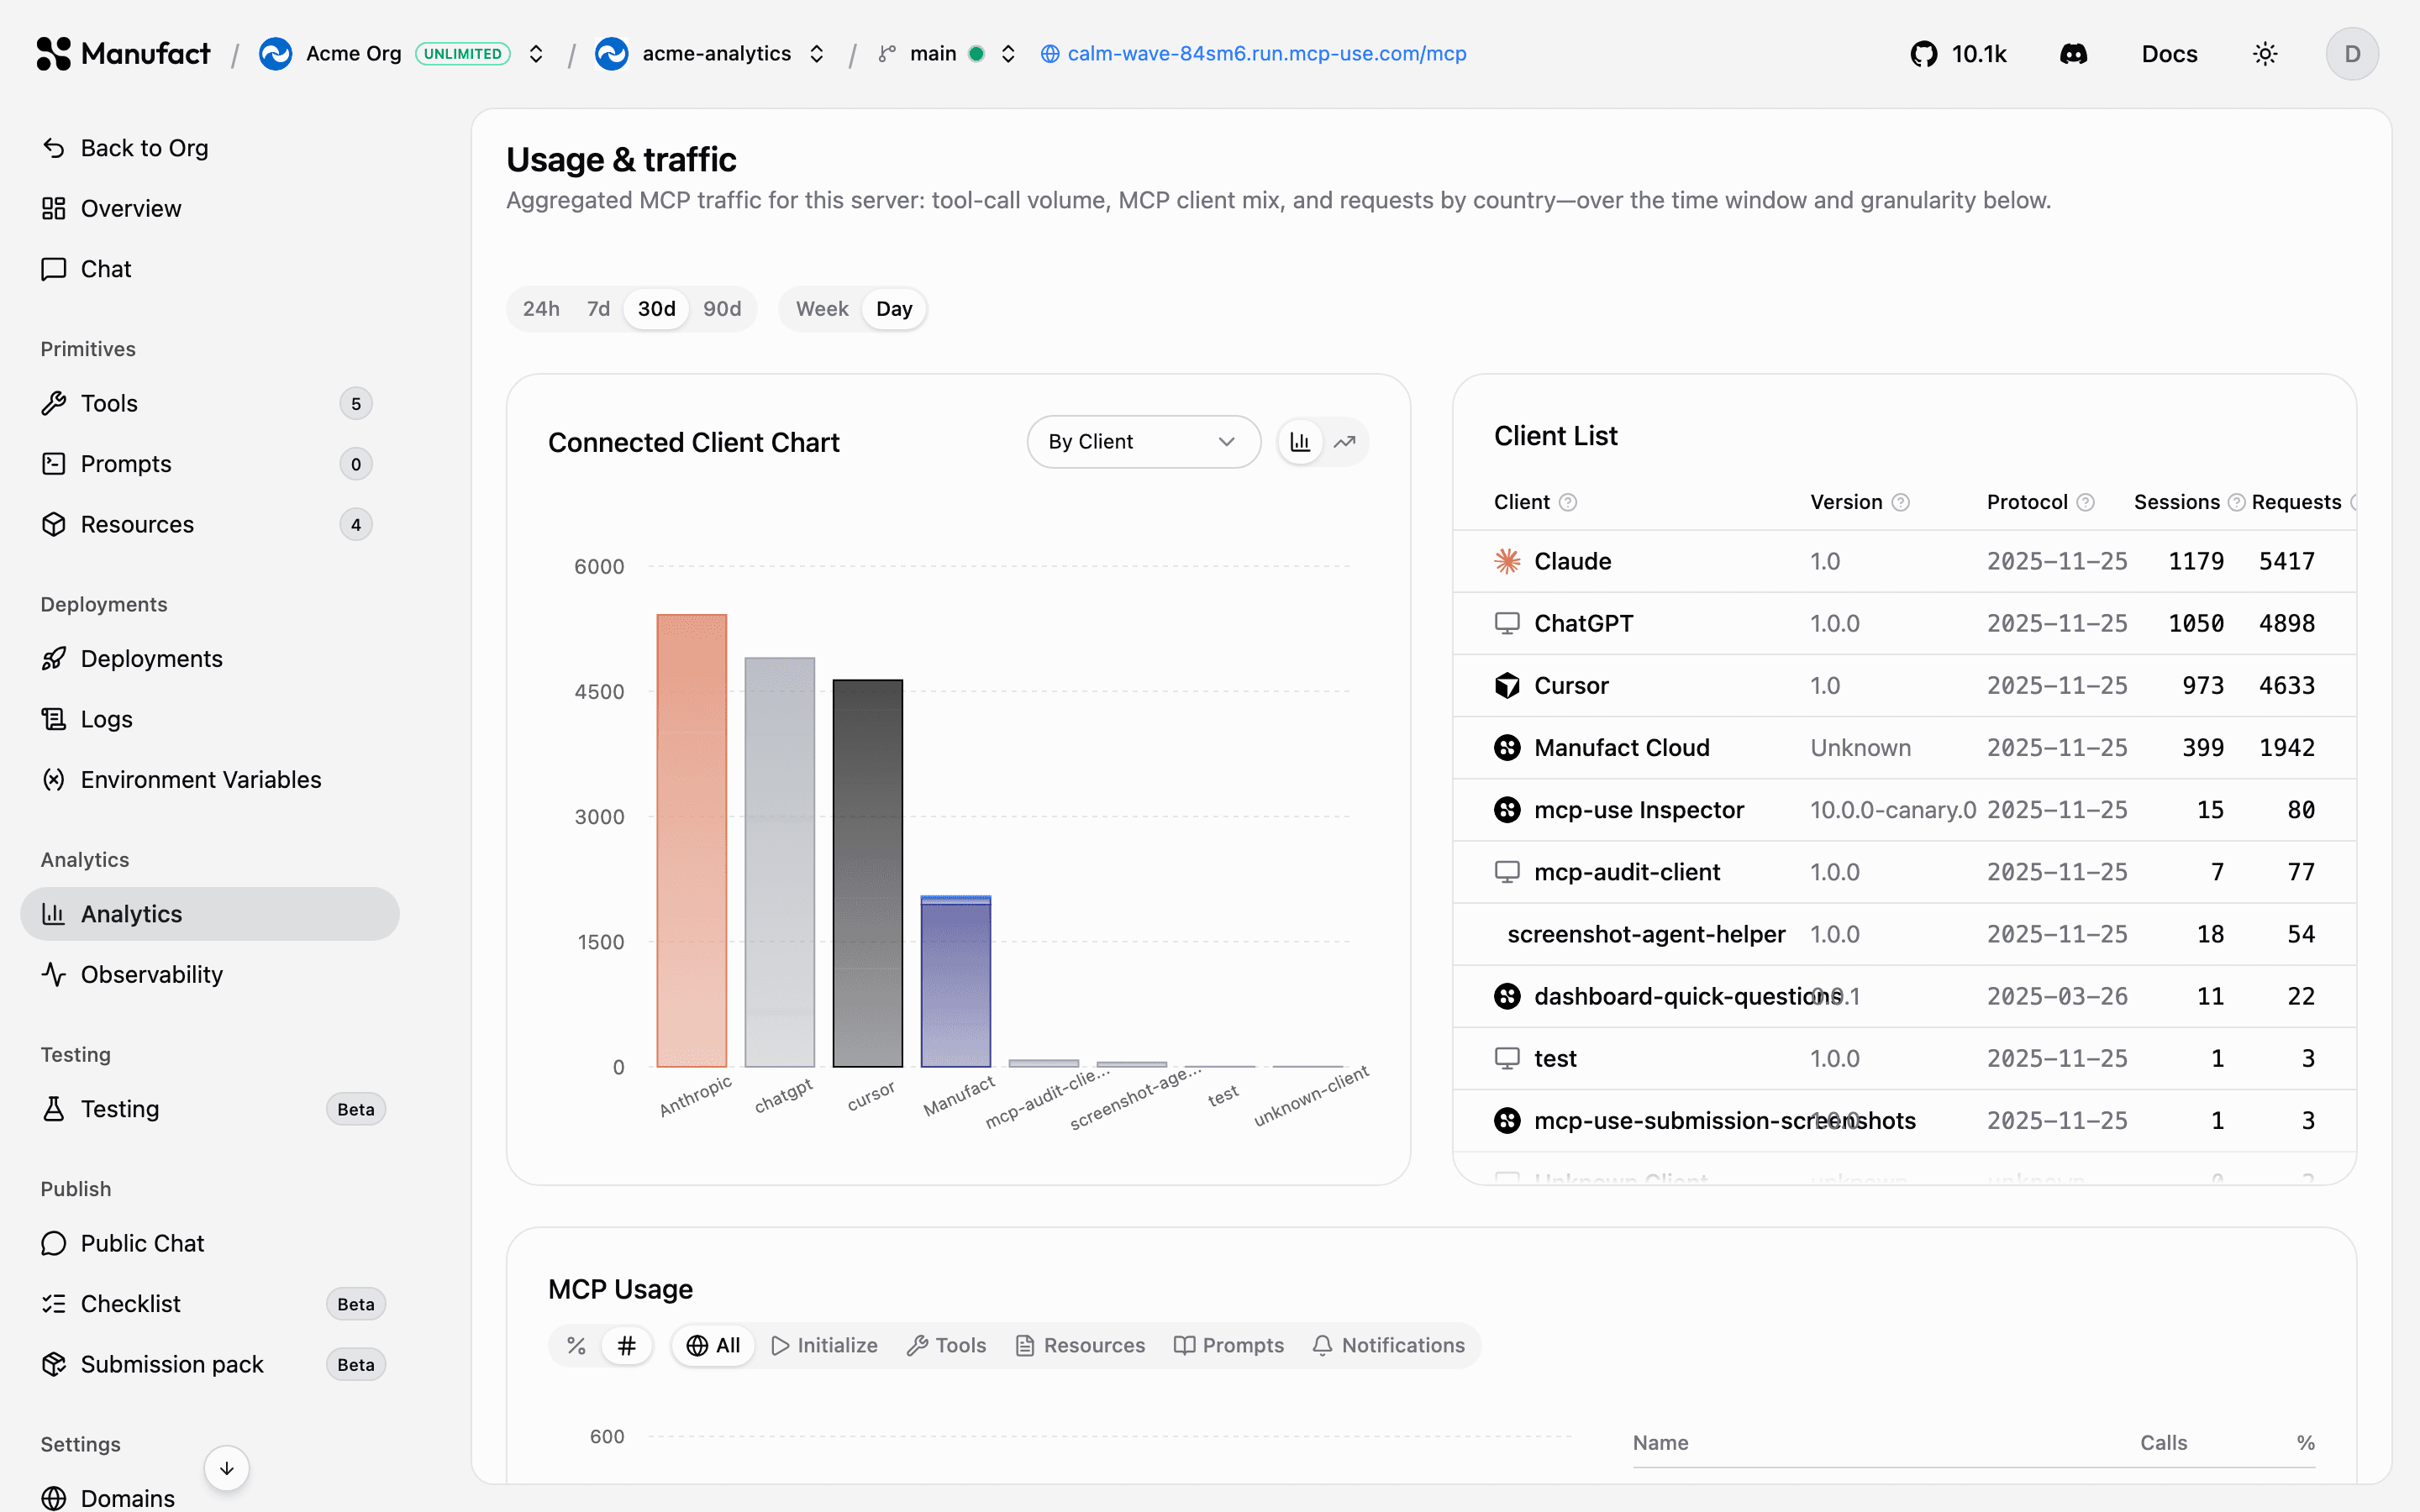
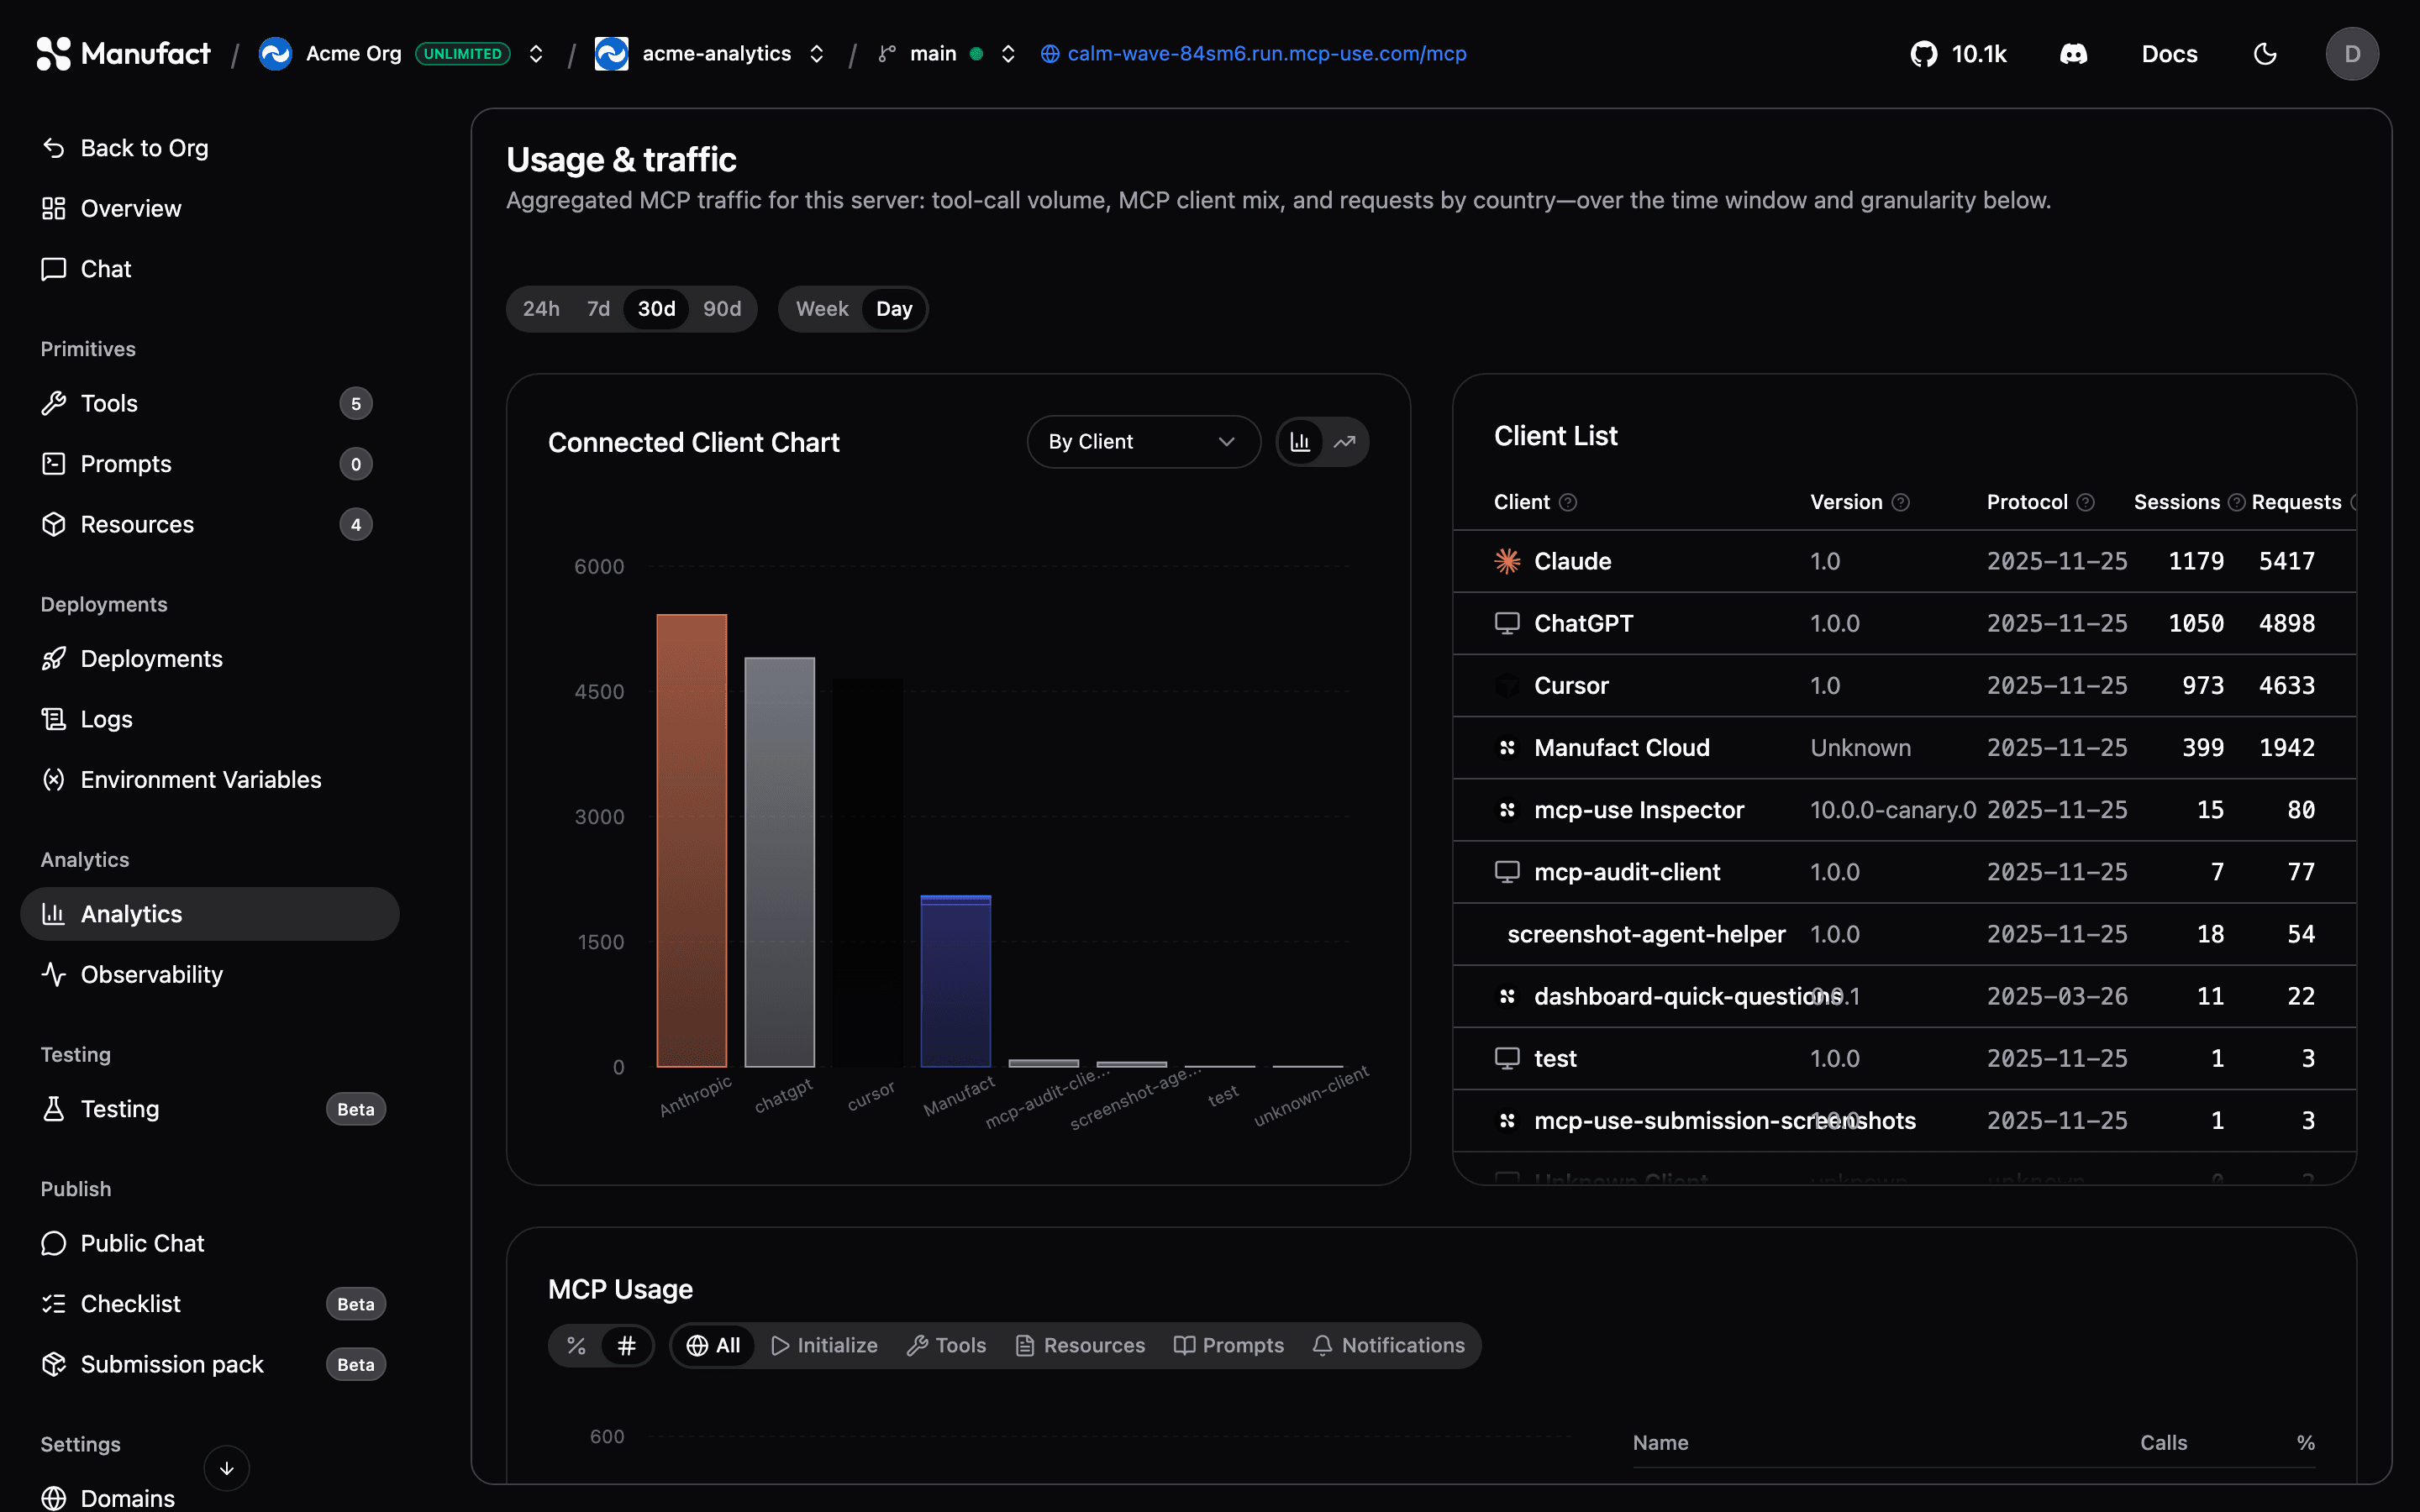
Clients
The Clients card shows which MCP clients connect to your server — Cursor, Claude, ChatGPT, Windsurf, custom agents, and others.
Toggle between a bar breakdown and a timeline view, and switch the breakdown dimension between Client, Version, and Protocol. A per-client health table mirrors the usage card: calls, error rate, and latency percentiles.
Expand a client row to see matching sessions, or follow View all to open the Sessions tab pre-filtered for that client.
Geographic distribution
Requests by country maps where traffic originates. Expand a country row to see sessions from that region and jump to the Sessions tab with the country filter applied.
Goals
The Goals card clusters what users are trying to accomplish, derived from session intent. AI-discovered goals appear with a brain icon; you can Keep (pin), Edit, or Archive them, or create manual goals yourself.
Each goal shows a success-rate trend chart (Achieved, Failed, Unknown per day) and an expandable session list. Until enough tool-call sessions exist, the card shows a learning progress state instead.
Goal classification requires User intent capture — see Analytics capture in Settings.
Average output tokens
The Average Output Tokens card estimates how much text your tools, prompts, and resources return to clients (~4 characters per token). Filter by All, Tools, Prompts, or Resources, and switch granularity like the other charts.
Horizontal bars compare definition vs response token segments per entity; a time-series chart tracks the average over the window. Full detail requires Capture payloads to be enabled.
Toolbar controls
- Time range — pill switcher for 24h, 7d, 30d, and 90d.
- Internal traffic — include or exclude Manufact dashboard, inspector, and checklist traffic (off by default).
- Capture settings — link to Settings → Analytics capture.
Analytics data refreshes automatically every few seconds while the tab is open.
Retention by plan
How far back you can look depends on your plan: 7 days on Free, 30 days on Hobby, 365 days on Startup, unlimited on Enterprise. See Billing & plans.
Session timeline
Click any session badge or row across Analytics cards to open the session timeline drawer: a vertical replay of every MCP event in that interaction — methods, errors, arguments, response links, and AI-assigned goal/outcome when available.
For the full searchable session list, use the dedicated Sessions tab.
Going deeper
Analytics shows aggregate trends and health. To inspect individual gateway requests in real time, use Gateway Requests. Org-wide aggregates (total servers, tool calls, and sessions over the last 30 days) are also shown on the organization Dashboard.