Gateway Requests
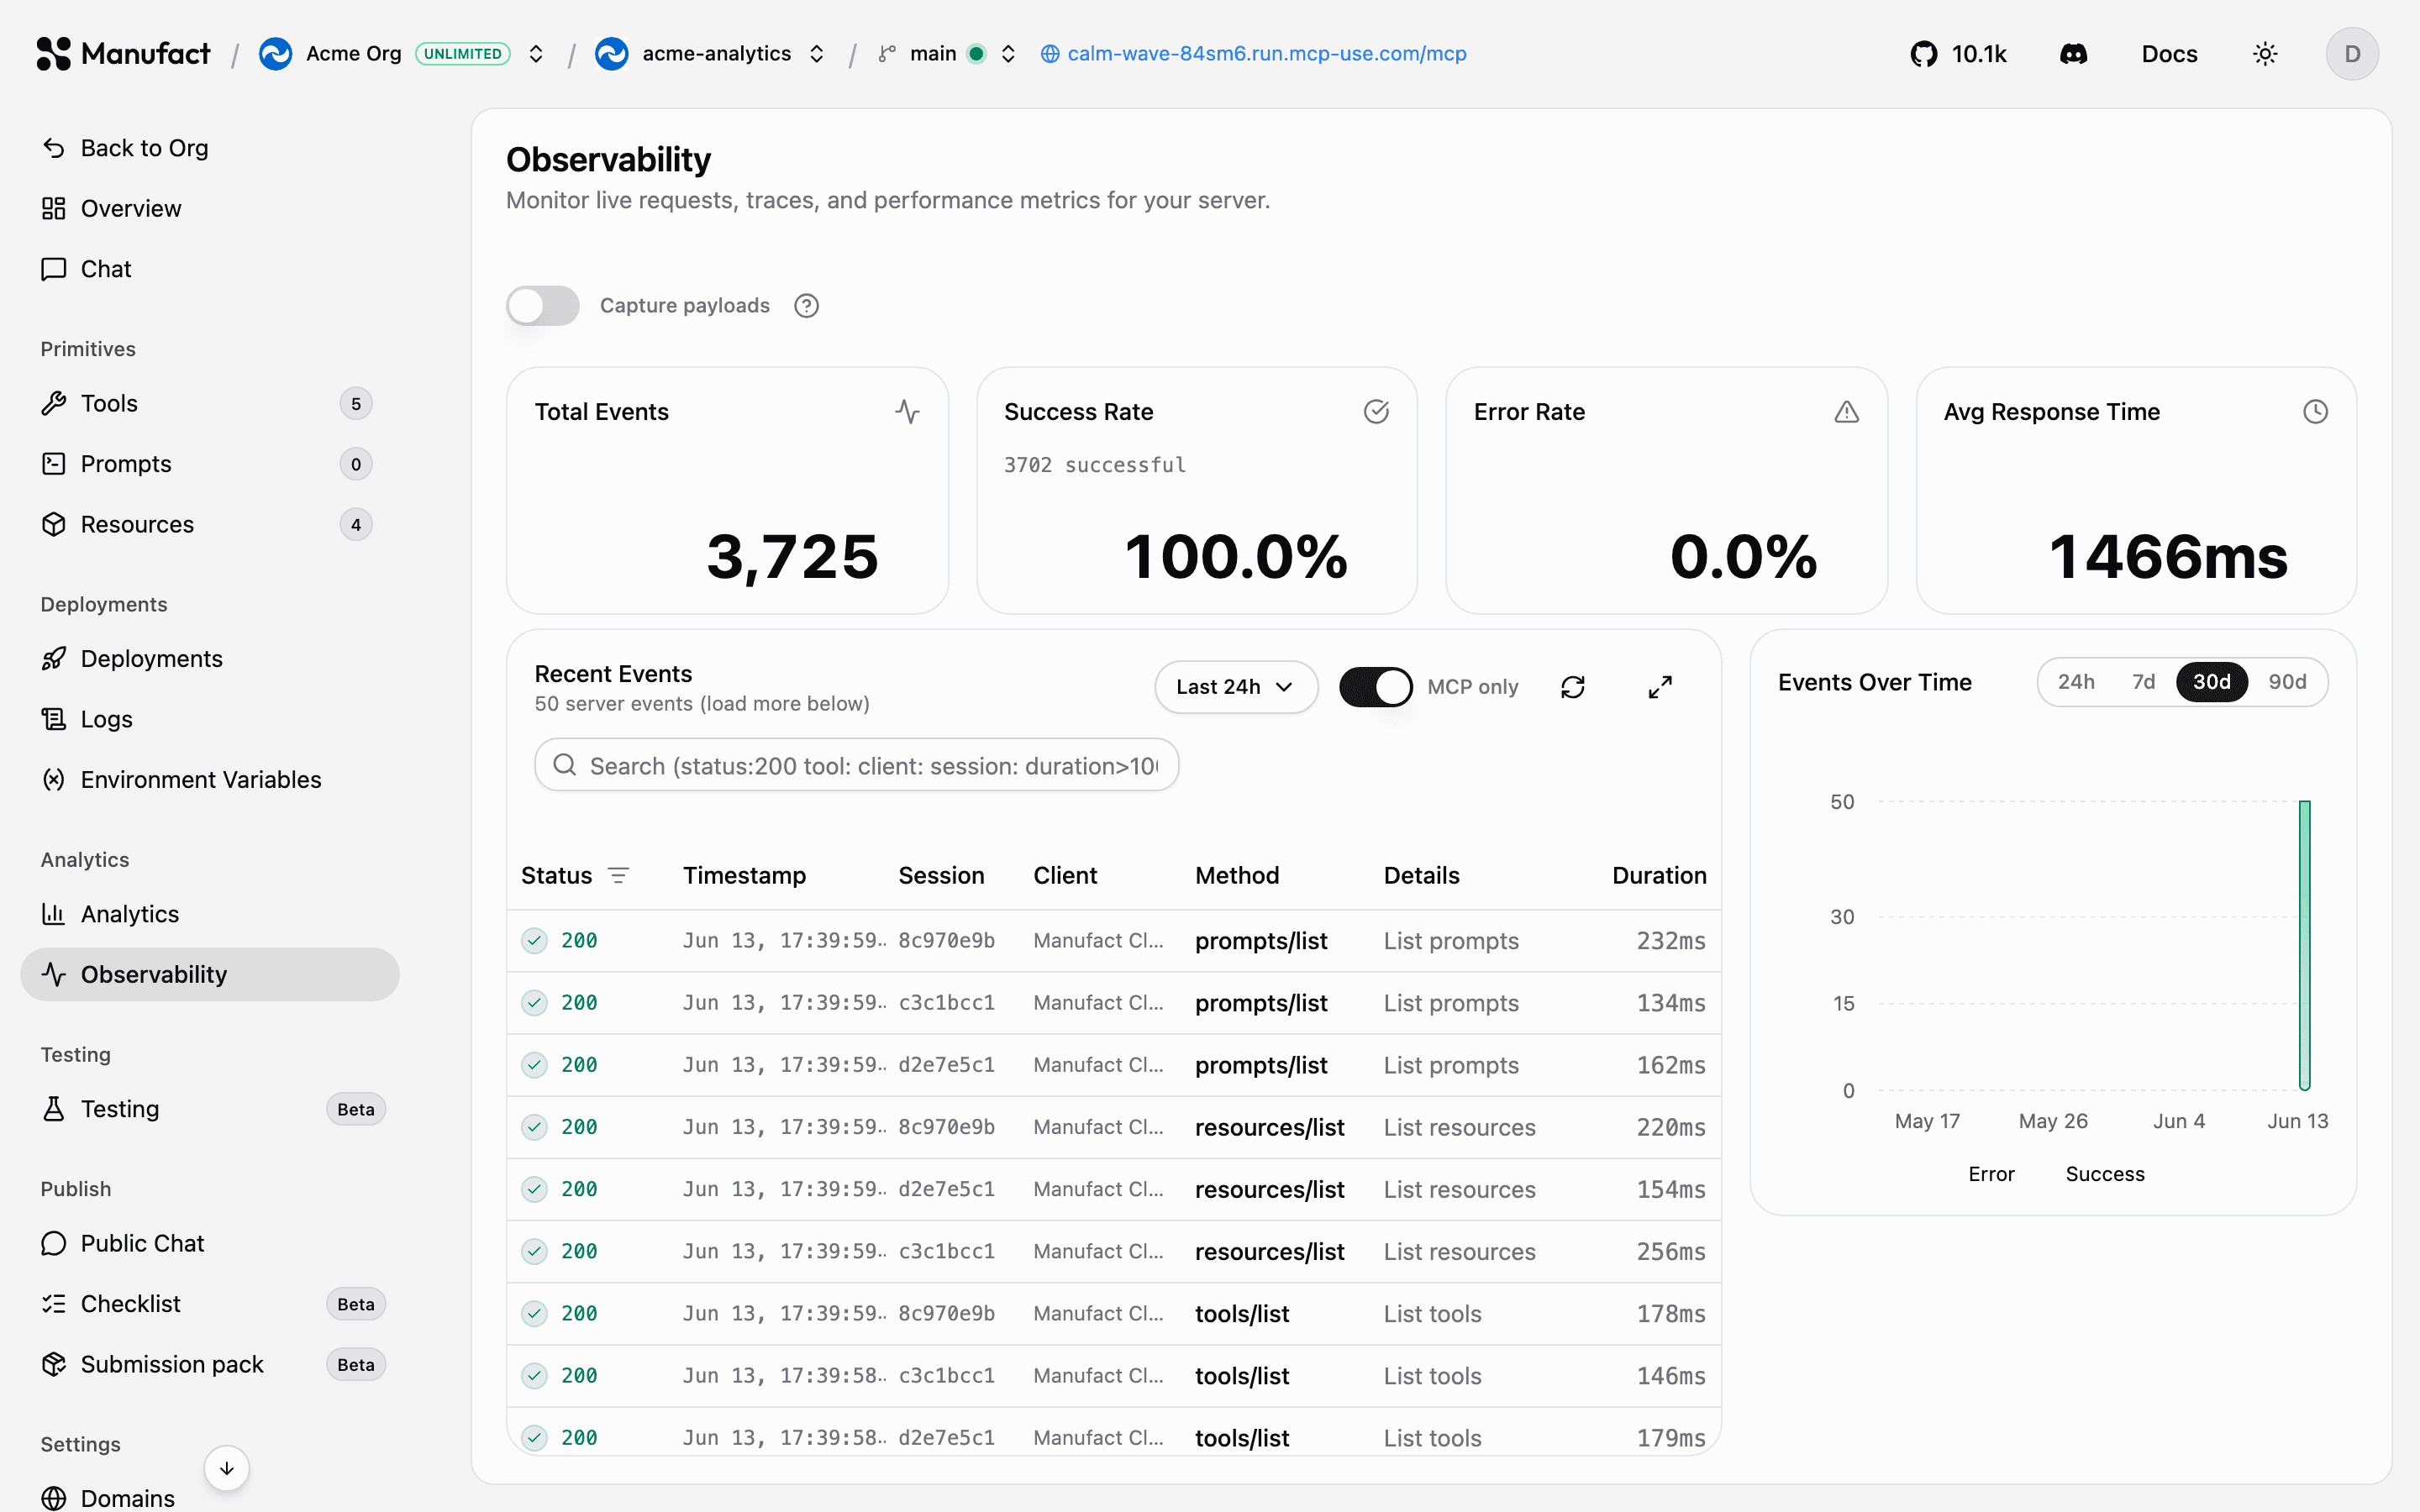
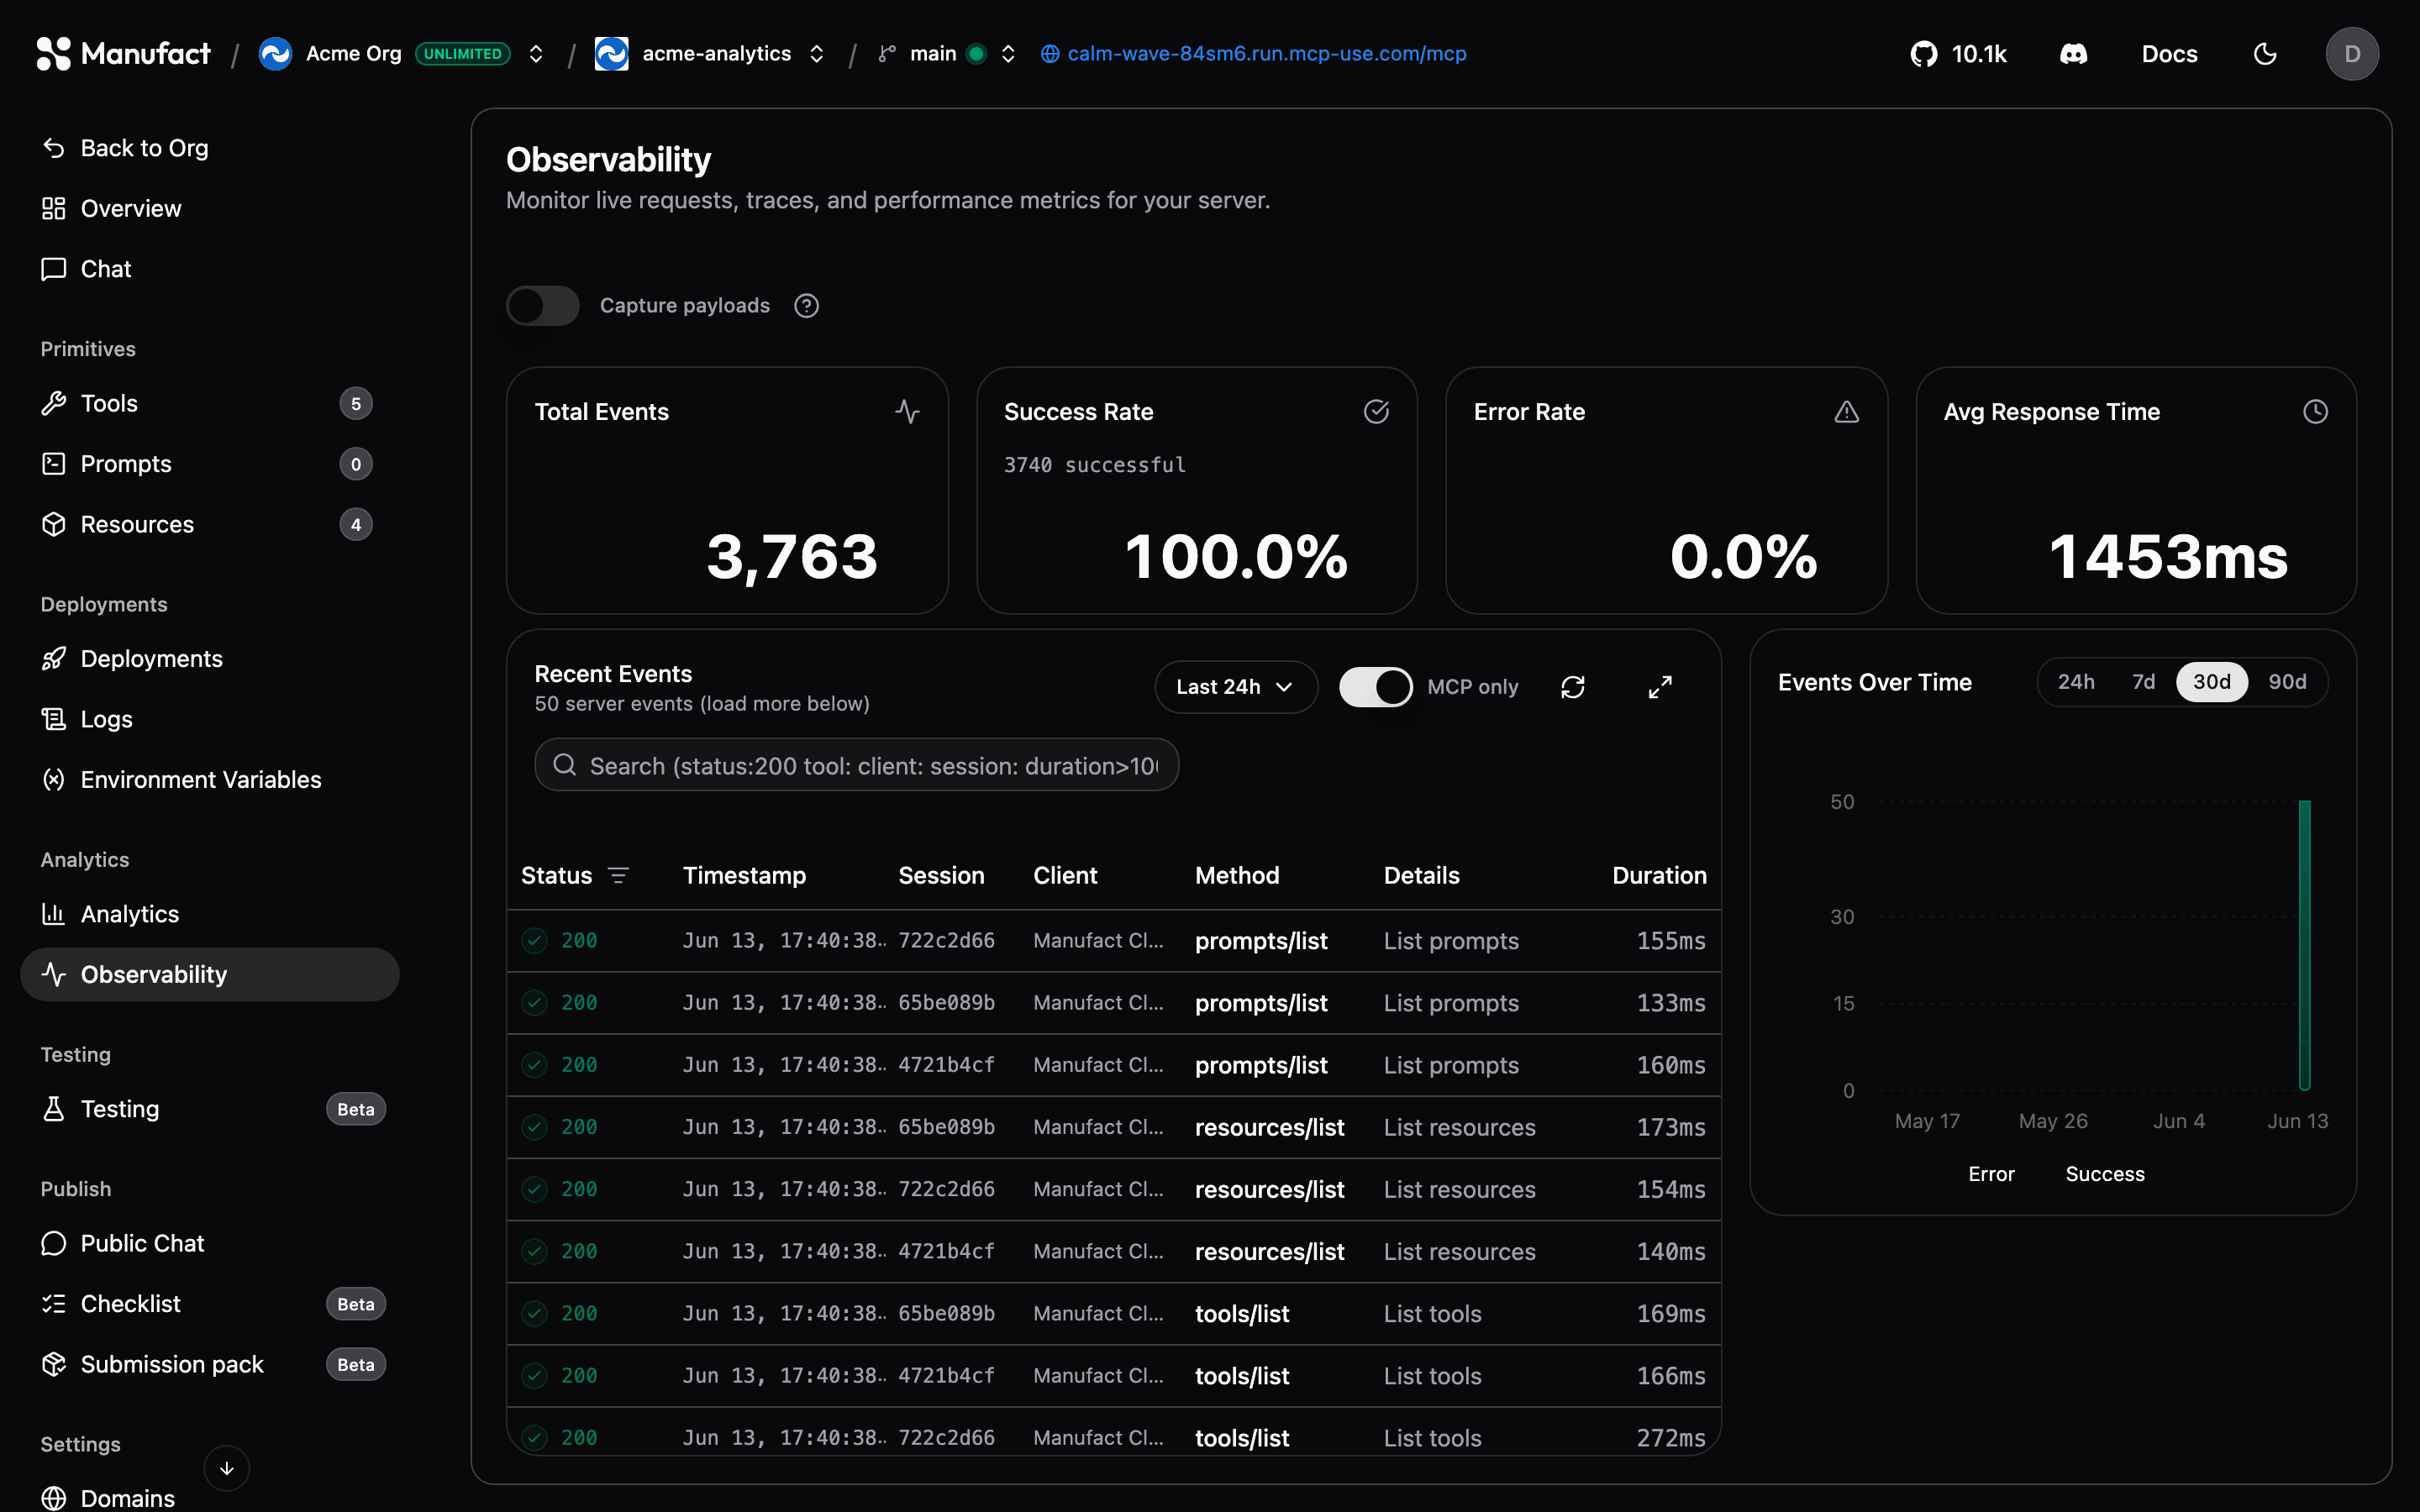
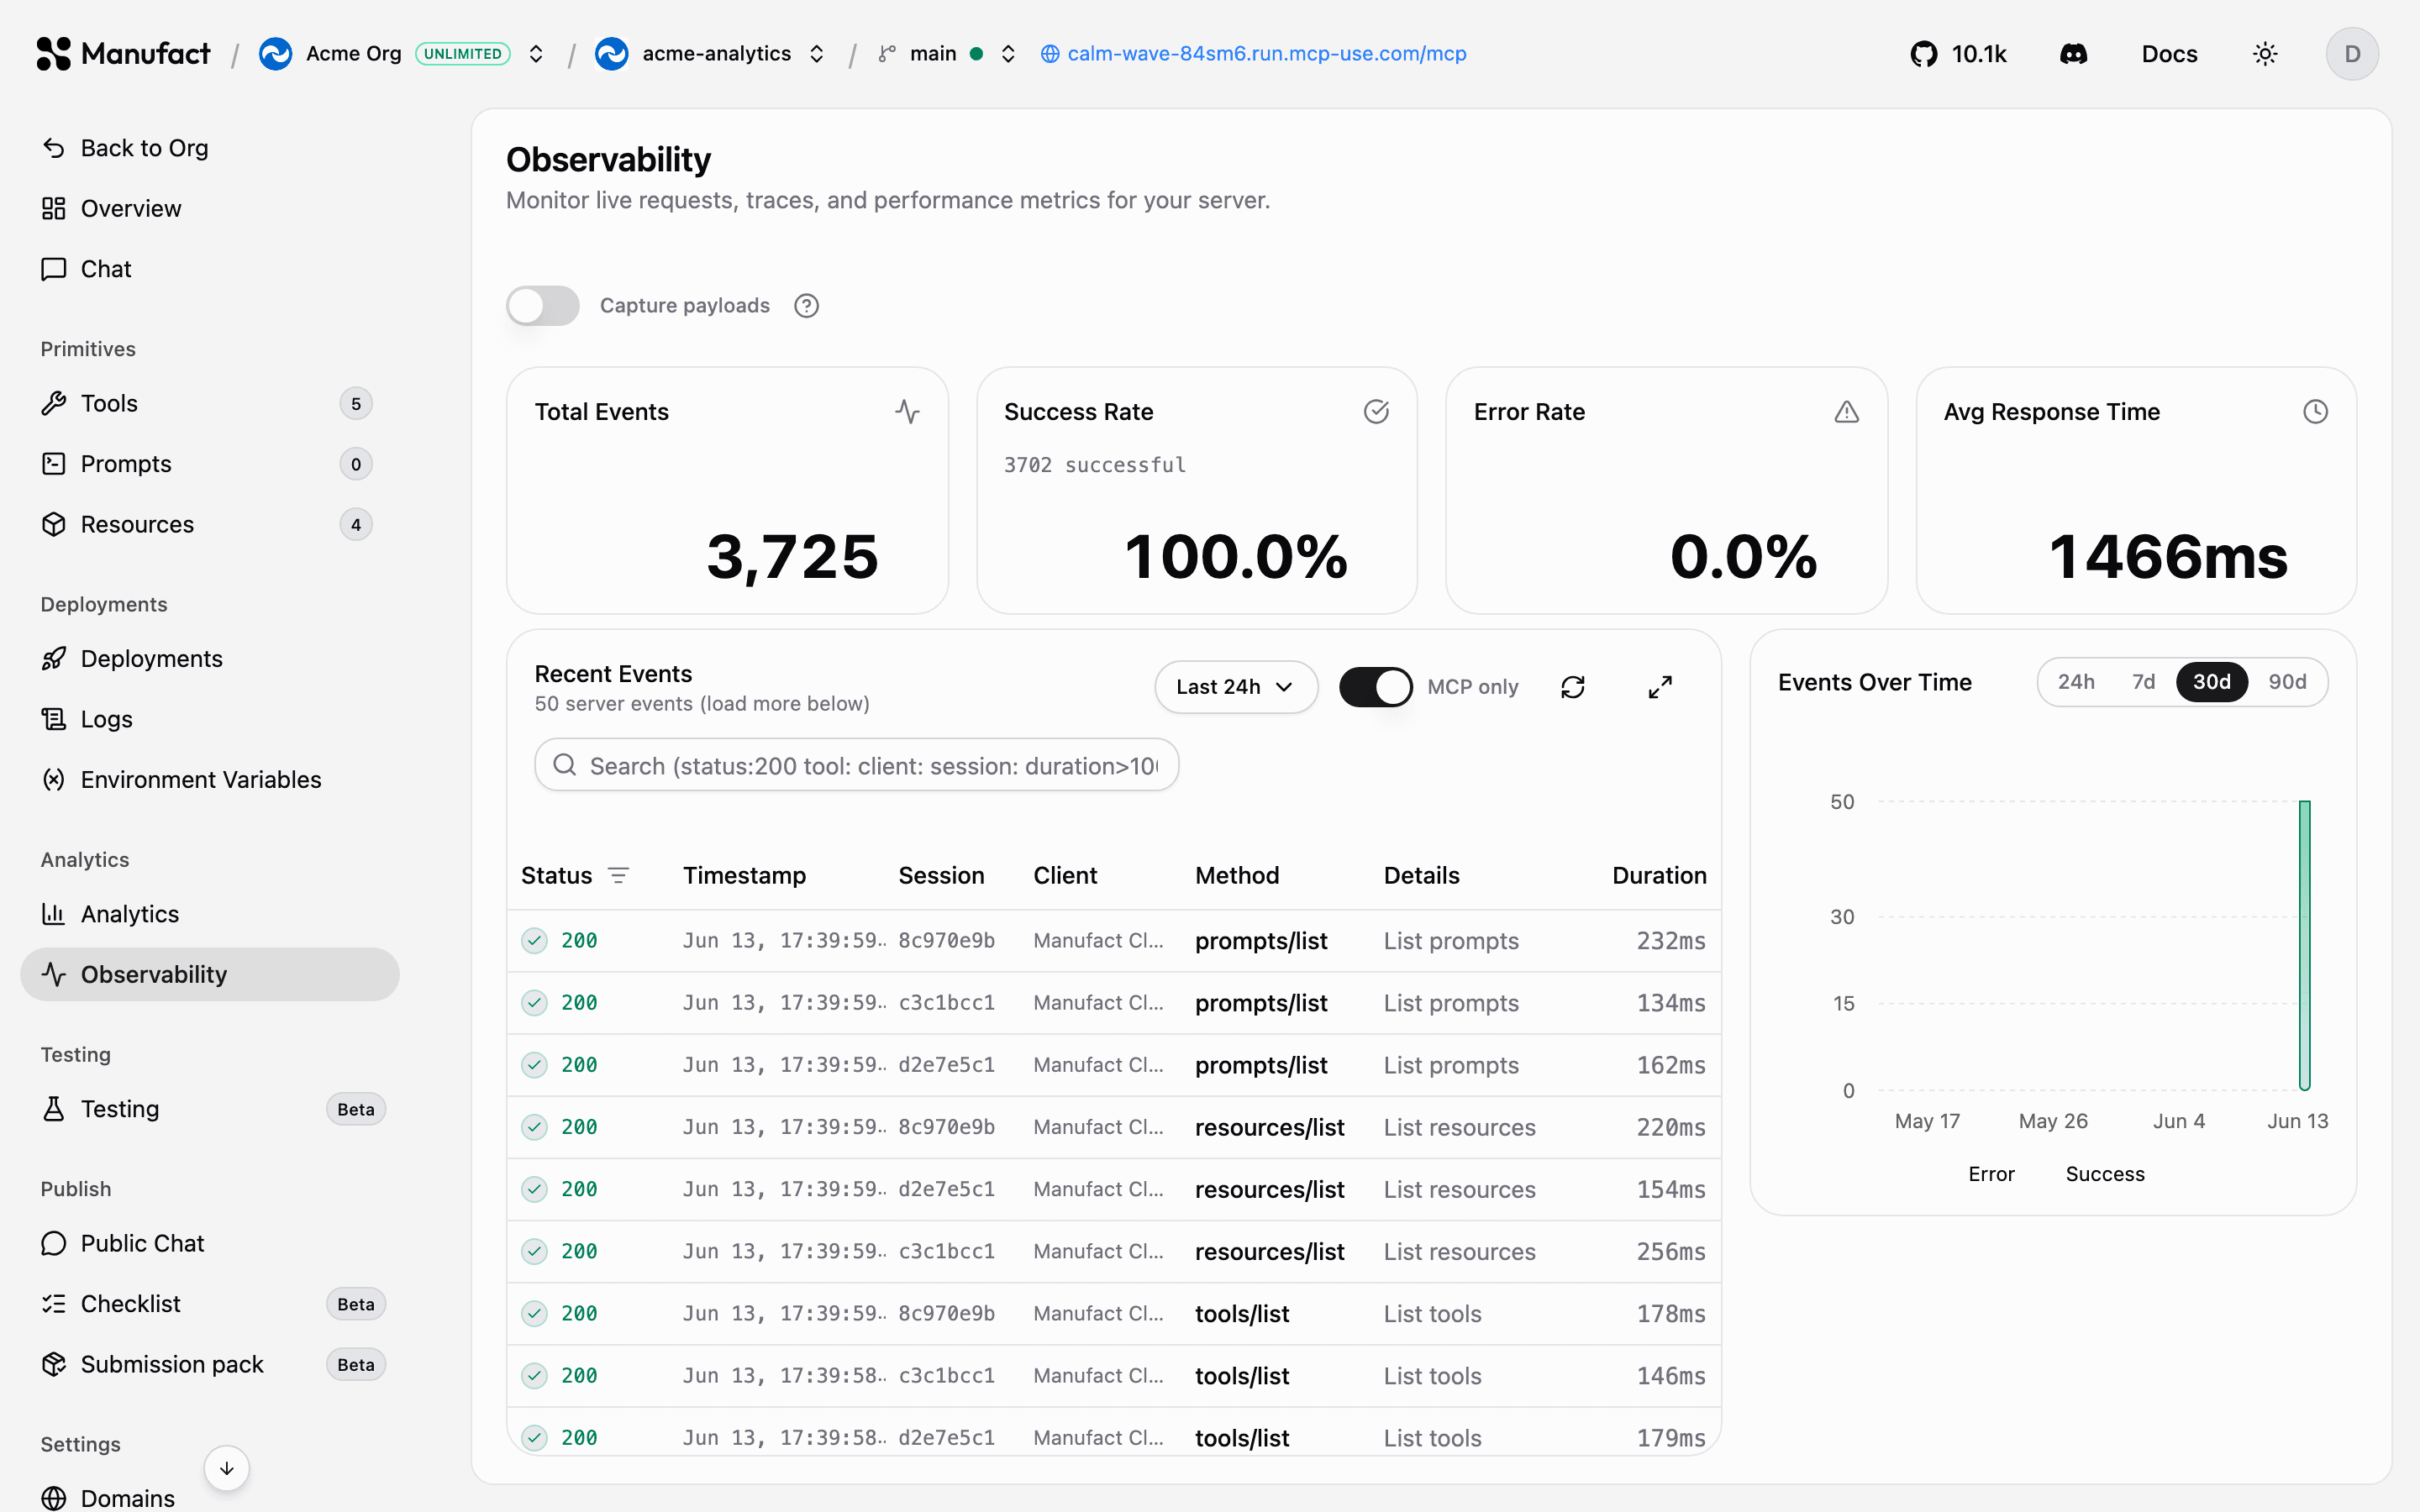
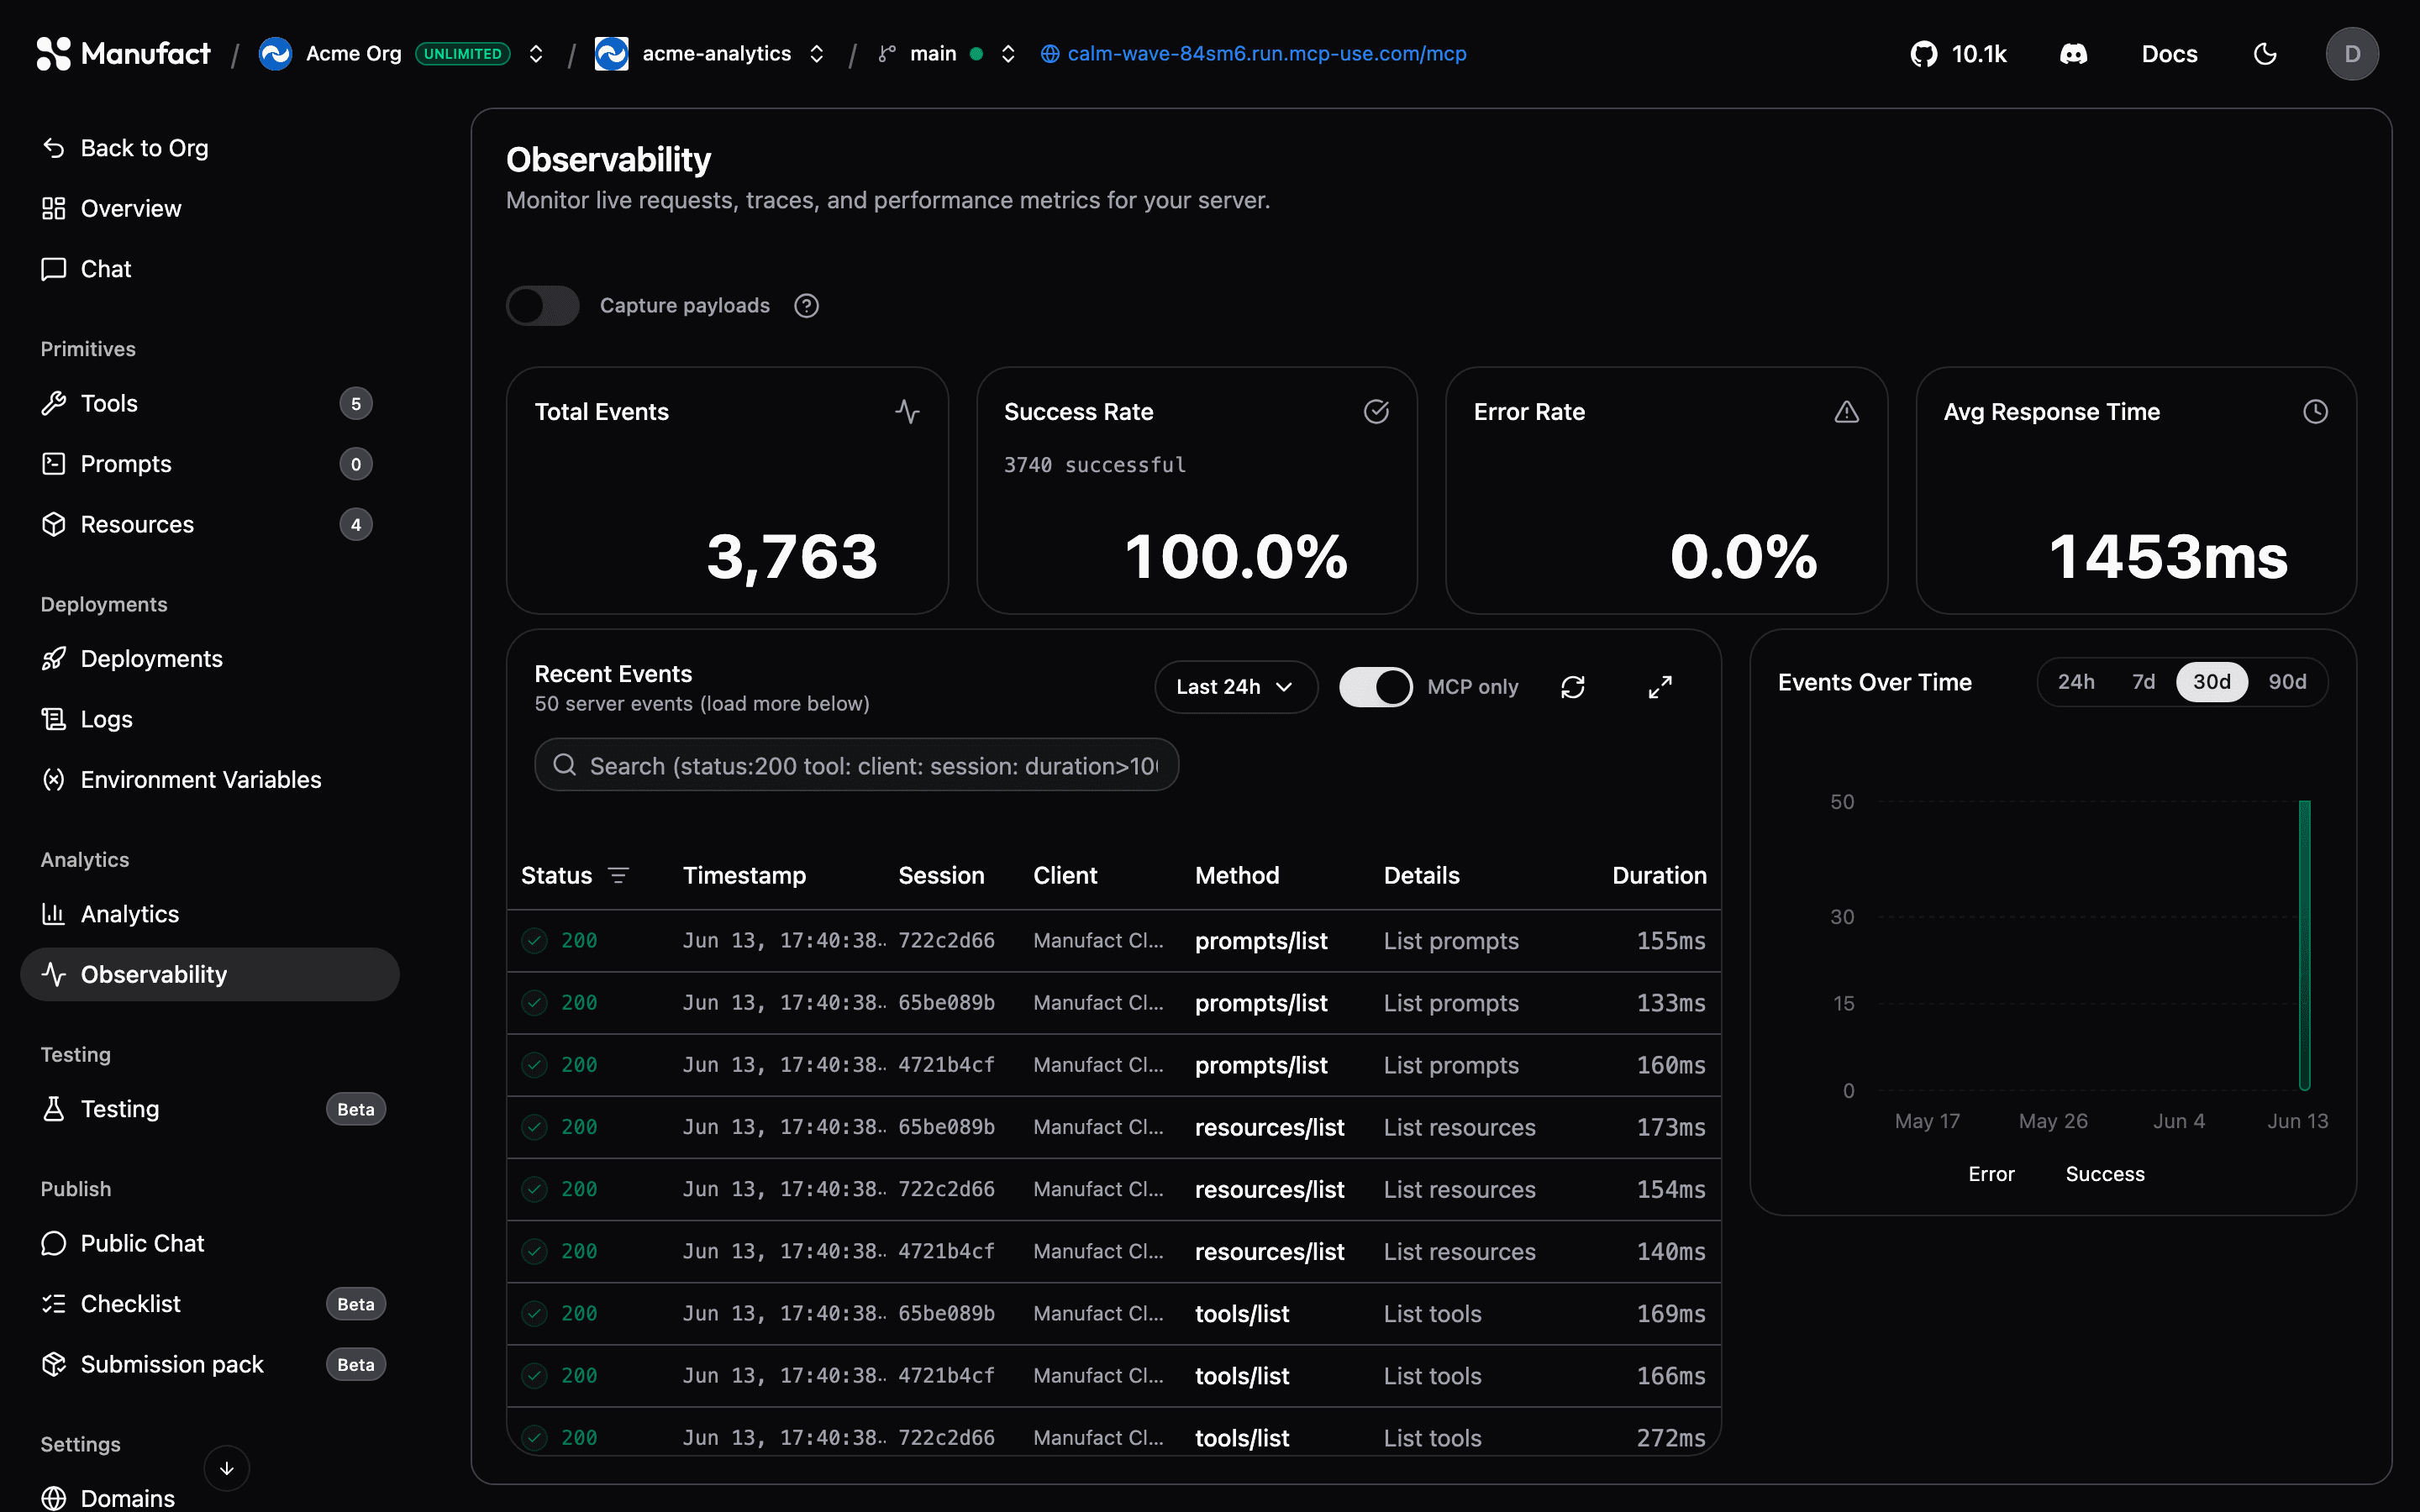
Monitor live gateway requests, filter by status and client, and optionally capture payloads.
While Usage & traffic shows aggregate trends, the Gateway Requests tab shows individual events: every request flowing through the gateway, refreshed every few seconds.
Event stream
The event table lists each request with its status, timestamp, session, client, method, details, and duration. Use the search bar and column filters to isolate specific tools, error responses, or clients:
- Status — success, error, or other outcome
- Client — MCP client name
- Method — MCP method (e.g.
tools/call,initialize)
Click an event to open the session detail view: the full sequence of requests in that MCP session, so you can reconstruct exactly what a client did — initialization, tool listing, tool calls, and errors — in order.
For grouped errors tracked across sessions, see the Issues card on Usage & traffic. For a replay-oriented view with goal and outcome context, use Sessions.
Payload capture
By default Manufact stores request metadata only. Toggle Capture payloads to also store full request and response bodies for each event — invaluable when debugging why a tool call failed or what arguments a client actually sent.
The same toggle lives under Settings → Analytics capture, along with User intent capture.
Sensitive data
Payloads can contain user data. Enable capture only when you need it, and disable it again when you're done debugging.
Performance metrics
Charts above the event stream track request volume, error rates, and latency over time, scoped to the same filters as the table.
Retention
Gateway request data follows the same retention windows as analytics: 7 days on Free, 30 on Hobby, 365 on Startup, unlimited on Enterprise.