

Traces
Browse, filter, and replay MCP traces on your server.
A trace groups related MCP events recorded by the Manufact gateway. Open the Traces tab to find client activity, inspect goals and outcomes, and replay the recorded events in order.
Trace table
Each row shows:
- Client and version
- Actor — a name or email when available, otherwise the actor ID
- A mini event chart (recent activity dots)
- Goal and Outcome once the trace has been labeled (Achieved, Failed, Unknown)
- Tool calls, Errors, and Country
- Last seen timestamp
Click a row to open the trace timeline drawer — the same replay view available from Analytics cards.
Actor identification
An actor lets you explore a caller's activity across traces. Enable Identify actors in Settings → Analytics to show available names and emails. It is off by default and works independently of Capture payloads.
When identification is off, the trace timeline offers Enable actor identification just above the Actor entry:
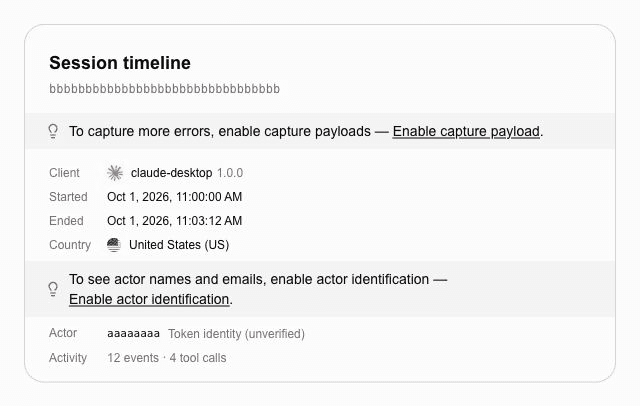
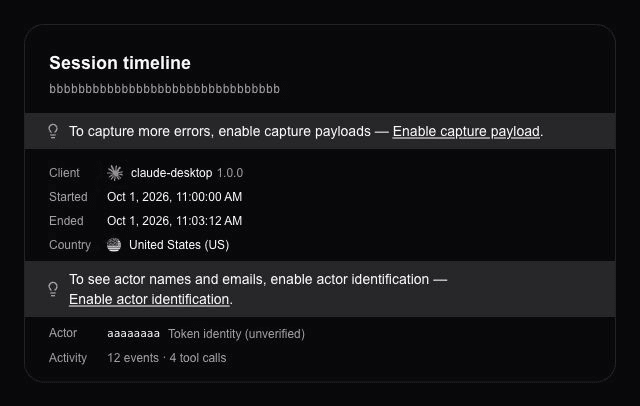
When a name is available, it appears in the trace table and timeline. Click the actor to view its activity across traces. This example shows Alex Morgan, with [email protected] in the timeline:
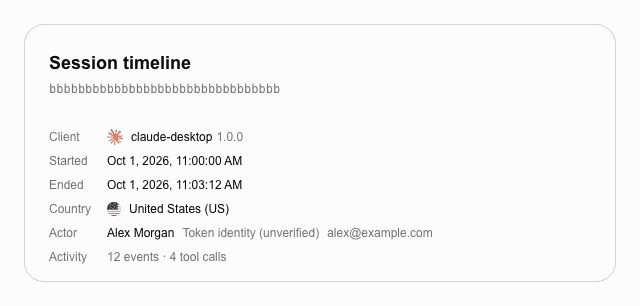
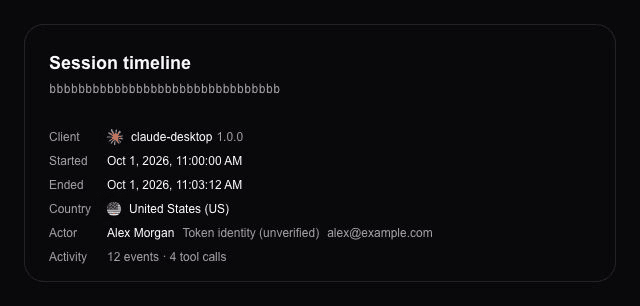
The screenshots use fictional identities and trace data.
Identity labels
Some labels appear as Token identity (unverified). Identity labels help you recognize activity. Do not treat them as proof of identity or use them for access control.
Why an actor might have no name
- Identification is off: check Identify actors in the server's Analytics settings.
- Older activity: names may be unavailable for traces recorded before identification was enabled.
- No identity available: your server's authentication setup may not support a recognizable name for every caller.
- Retention: older identity labels may no longer be available.
Disabling identification stops collection and hides identity labels. Previously collected metadata remains until its analytics retention expires.
Filters and sorting
Use the toolbar and column controls to narrow the list:
- Time range — 24h, 7d, 30d, or 90d
- Internal traffic — include or exclude Manufact dashboard traffic
- Only with tool calls — hide initialize-only traces (on by default)
- Client, Goal (with outcome), and Country column filters
- Sort by Tool calls, Errors, or Last seen
The table loads 50 traces at a time — scroll to fetch more.
Deep links from Analytics
Cards on Usage & traffic link here with filters pre-applied — for example, all traces for a specific client, country, or tool during a time window. URLs carry query parameters so you can bookmark or share a filtered view.
Trace timeline
The timeline drawer shows every gateway event in order: initialization, tool listing, tool calls, errors, and optional payload previews when Capture payloads is enabled.
When the trace has been labeled, an insight panel at the top shows the assigned goal, outcome, and intent summary (if one was recorded). You can manually override the goal or outcome from the drawer.